Marketing Analytics
Semester Projects
Semester Projects
Group member of several projects over the course of the semester for marketing analytics course. Projects were designed to help aid the students with real world marketing analytics practices. The main projects covered data cleaning, Tableau Visualizations, and an analytic based marketing plan. The Tableau section of the semester was guest taught by data analytics company, Interworks. These projects were spread out throughout the semester. In total, about 15+ hours were spent on these projects.
‣ Professor: Jerry Rackley | Class: MKTG 3653 – Marketing Analytics
‣ Timeframe: Jan 2020 – Mar 2020, @ Oklahoma State University
‣ Team: Campbell Boulanger, Gabbie Beaver, Hallie Callison, Blaike Finley, Daniel Guajardo, Mackenzie Moore, Jacey Vratil
‣ Programs used: Microsoft Excel, Tableau
![]()
![]()
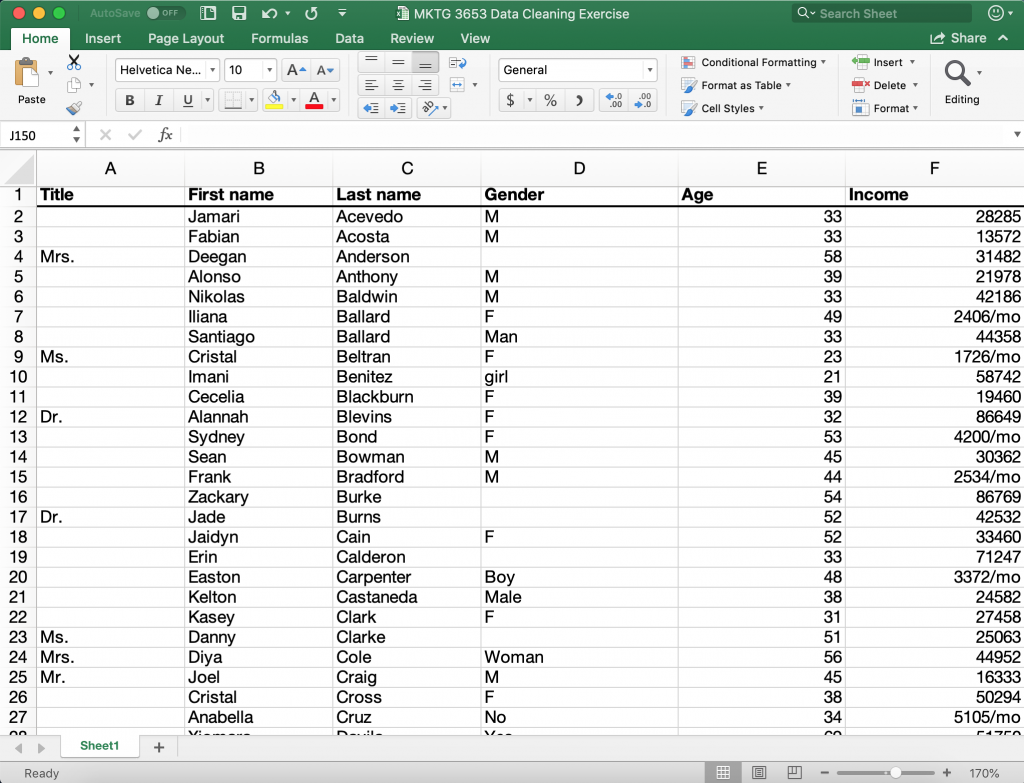
Students were given a 136 row excel sheet with real sample survey response data. The students were then given a set of data cleaning tasks to complete with the data. The answers/results received would then be tested to check for accuracy.
The list of actions included:
• Cleaning the age data
• Normalizing the gender information
• Filling in missing gender information
• Normalizing the income information
Calculations performed after cleaning:
• Total the number of entries for each gender
• Average the ages for the whole group and by gender
• Determine the average income for the whole dataset and by gender
• Determine how many in the dataset and by gender have incomes over $40,000.
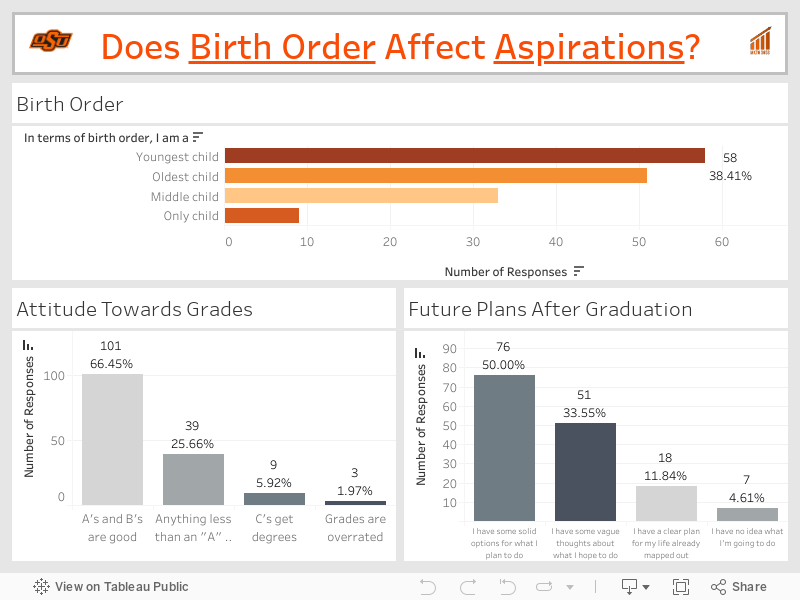
Students were given a “cleaned” excel file with real sample survey response data. Using Tableau, the students created a visualization correlating two or more responses to make an underlying assumption. After several rounds of refining, the group was to pick the best visualization and create a video explaining it.
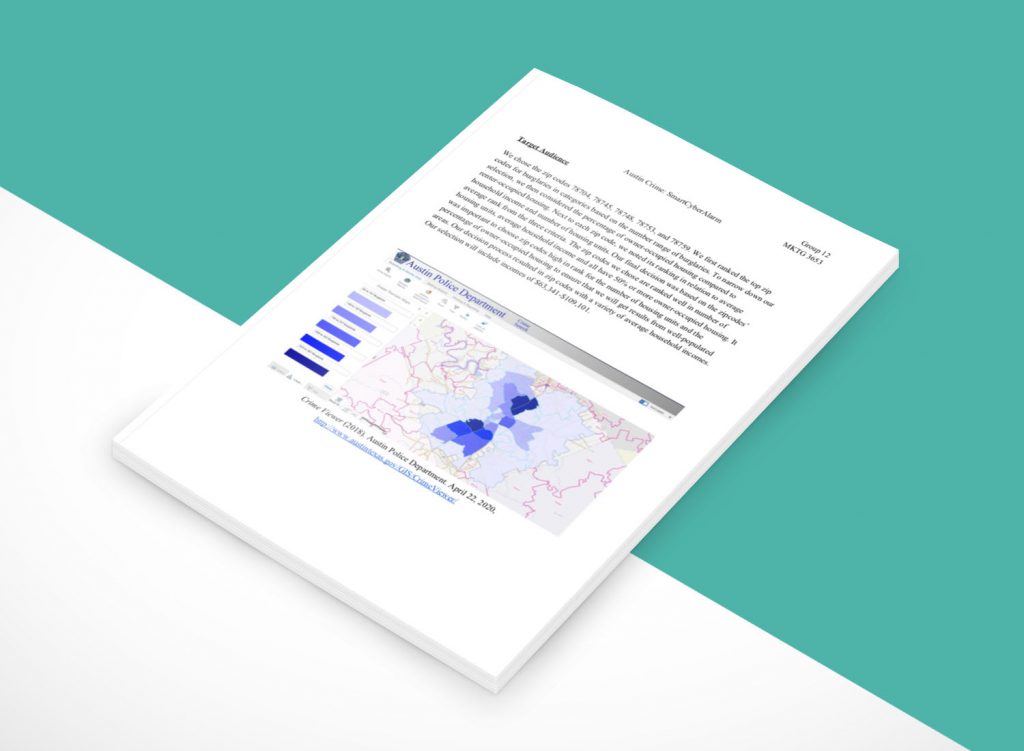
The final semester project involved analyzing several sources of data to develop a go-to-market plan for a new residential alarm system. This project blended data, analysis, and creativity.
Project Learning Goals:
Marketing Plan
Presentation
![]() Marketing Analytic Practices
Marketing Analytic Practices
![]() Data Cleaning
Data Cleaning
![]() Analytics Processing
Analytics Processing
![]() Tableau Visualizations
Tableau Visualizations
![]() Using Marketing Analytics to Create a Marketing Plan
Using Marketing Analytics to Create a Marketing Plan
While a “good” grade was a desirable outcome for this project, the goal was to equip ourselves and peers with real world marketing analytics practices. Data driven marketing is becoming more prominent now than ever and a highly sought after skill in the marketing industry. Using time in and out of the classroom, well executed reports were presented to the teacher and class which outlined our team’s visualization and marketing plan. Positive feedback was given over our projects. As a group, we received an A on every project.